
1229 DELANO ST
0.0%
-
Rental Rate$0
Purchase Price

Cash on Cash (CoC) Return is the amount of cash flow you receive in one year compared to the amount of cash invested.
Your Cash on Cash gauge reflects a goal of . You can adjust your CoC goal in Settings - Blue Chip Criteria.
The formula for Cash on Cash Return is:
Using the value from the analysis on this page, the CoC Return is calculated as follows:
Continue to learn more!:
Rescover Investment Term Library
-
Initial InvestmentInitial Investment is the total amount of money you put in upfront to purchase and prepare the property—like your down payment, closing costs, and any immediate repairs or improvements. This figure helps you see how much of your own cash is tied up before rental income (or other revenue) starts coming in.
The initial investment for the property on this page is summarized in the table below:
Calculating
| Purchase Price | |
| Plus: Title Charges | |
| Plus: Rehab Expense | $0 |
| Total Cost | $0 |
|---|---|
| Less: Loan Amount | () |
| Plus: Loan Fees | |
| Plus: Working Capital | $0 |
| Initial Investment | - |
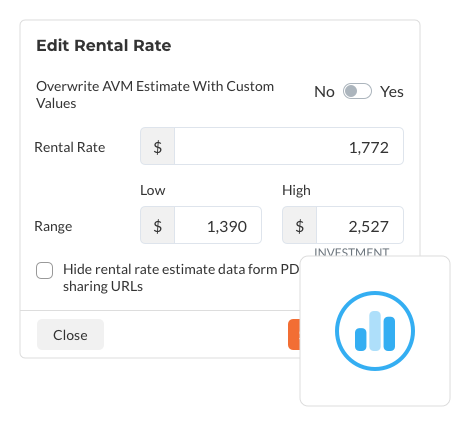
Automated Valuation Modeling (AVM) uses machine learning algorithms to predict the rental rate for the subject property. These values are updated as often as monthly, based on closed transactions of similar properties in the area. Adjustments to the rental rate in the Rescover calculator will not affect the figures displayed on this card.
Own a large new construction home in East Austin where location meets high design and luxury. Minutes from Mueller's Thinkery and multitude of parks, as well as some of East Austin's favorite restaurants like Veracruz and Bird Bird Biscuit, and fitness opportunities at Austin Bouldering Project. Additionally, this property is just 15 minutes from the airport, the Domain, and Downtown Austin. This four bedroom, four full bathroom brand new home features natural light pouring in from all directions while maintaining a sense of privacy and and a soothing finish-out and color palatte. On the ground floor, you will find a private garage, full bedroom and bathroom, and a gourmet kitchen with white and copper-accented Cafe appliances, and a large open dining and living area. Off the dining area is an expansive sliding door that leads to a private fully-fenced side and backyard space. The stairs lead to a wonderfully laid out and function second floor with another secondary bedroom and full bath, an office/loft/flex space and a primary bedroom with ensuite full bathroom with double vanity and double shower heads! An extra luxury off the primary suite is a private covered balcony. On the third floor, there is another bedroom that could be used as a second primary suite as it has a full attached bathroom with double vanity and large glass-enclosed shower. Don't forget to see the top of the Downtown Austin skyline from the south-facing third floor window! This home will have a $0 Homeowner's Association fee. There will be two other homes available in this development with similar layouts, pricing, and finishes, as well as three 1,245 square foot unit 2's with three bedrooms, three bathrooms priced at $549,500.
Calculating
Annual Cash Flow
This chart shows how much profit or loss you generate each year after paying all property expenses, including mortgage. It helps you visualize whether or not the property is self-sustaining and the inflection point for when it is expected to become cash flow positive.
Return on Investment
This graph compares two ways to measure your annual return:
- Cash on Cash: How much income you earn relative to your original cash invested (down payment, closing costs, etc.).
- Return on Equity: How much income you earn based on your current equity (the portion of the property you actually own).
Watching both lines helps you decide if it's time to sell, refinance, or keep building equity.
- Cash on Cash
- Return on Equity

Create an account
to view KPIs!
Calculating
| Purchase Price | |
| Plus: Title Charges | |
| Plus: Rehab Expense | $0 |
| Total Cost | $0 |
|---|---|
| Less: Loan Amount | () |
| Plus: Loan Fees | |
| Plus: Working Capital | $0 |
| Initial Investment | - |
Calculating
| Mortgage Payment (P&I) | |
| Property Tax | |
| Property Insurance | |
| Total Monthly Costs |
|---|
Calculating
| INCOME | |
|---|---|
| Potential Rental Income | |
| Vacancy Loss | |
| Effective Income | |
| OPERATING EXPENSES | |
| Property Tax | |
| Property Insurance | |
| HOA | |
| Property Management | |
| Leasing Commissions | |
| Property Maintenance | |
| Utility Expenses | |
| Other Expenses | |
| Total Expenses | |
| Net Operating Income | |
| NON OPERATING EXPENSES | |
| Monthly Debt Service | |
| Capital Expenditures | |
| Total Non Operating Expenses | |
| Total Cash Flow | |
Calculating
| Property Value The property value displayed in this table shows the expected appreciation you will realize over the next 30 years. |
|---|
| Rental Rate The rental rate displayed in this table shows the expected future rental rates you will achieve over the next 30 years. |
| Monthly Cash Flow Monthly cash flow is the average amount expected to receive each month after operating expenses and debt service are paid. |
| Gross Wealth Accumulation Gross Wealth Accumulation is the amount you would expect to receive at the end of each year, including cumulative cash flow, and the gross proceeds at the sale of the home. |
| Net Gain on Investment Net Gain on Investment is the total profit (or loss) you see after accounting for every dollar spent—like the purchase price, repairs, and other costs—and every dollar earned from rental income or a future sale. Essentially, it answers, "How much did I actually make from this property when all’s said and done?" |

Calculating
| Effective Income |
|---|
| Operating Expenses |
| Net Operating Income |
| Non Operating Expenses |
| Annual Cash Flow |

View our full 30 year analysis
with an account!
Calculating
| Property Value |
|---|
| Loan Balance |
| Cost of Sale |
| Net Equity (End of Year) |
 School Information

View detailed school information
with an account!
Learn more about school information
Community Data

View neighborhood demographics and
community data with an account!
Learn more about community data
View property data from our assessor database with an account!
Activate Tax Data!Learn more about property records

Research courthouse records with a Property Suite Pro account!
Activate Courthouse Records!Learn more about property records

Offcanvas with body scrolling


